

Your process runs fine on paper. The average is on target, the control chart looks calm, and yet customers still reject parts. That gap between looking stable and actually meeting specifications is exactly what process capability measures, and if you can’t explain the difference between Cp and Cpk in a meeting, you’re not alone. Most operators and even some engineers use these terms loosely, which leads to bad decisions about scrap, rework, and equipment investment.
This article gives you the direct answer: process capability compares the voice of your process to the voice of your customer, using four specific indices. Cp and Cpk look at your process’s short-term potential, while Pp and Ppk account for real-world drift and long-term variation. Cpk and Ppk matter most because they factor in centering, not just spread, which is why a process can have a great Cp and still ship defects.
Below, we break down each formula, show you how to calculate them with real numbers, and explain what values like 1.0, 1.33, and 2.0 actually mean on your shop floor. You’ll leave knowing exactly which index to trust and when.
Why process capability matters for manufacturers
Manufacturers live or die by predictability. A process capability study tells you, before the customer does, whether your process can consistently produce parts inside the specification limits. Without that number, you’re guessing. You might be running a process that looks stable on a control chart but still generates 5% scrap because the spread of variation is simply too wide for the tolerance band you’re chasing. Capability analysis closes that gap between "in control" and "in spec," and those are not the same thing.
Think about the cost angle for a second. Every part that falls outside spec means rework, scrap, a warranty claim, or a line stoppage while someone sorts good from bad. A Cpk of 1.33 or higher generally signals a process capable of running with minimal defects, while anything under 1.0 tells you defects are baked into your process, not caused by an occasional bad operator or a dull tool. That distinction changes how you spend money. If Cpk is low, you don’t need another training session, you need a design change, tighter fixturing, or a different machine.
A process can be perfectly stable and still be incapable of meeting the spec it was built for.
Quality standards bodies treat capability indices as a baseline requirement, not a nice-to-have. Automotive suppliers working under IATF 16949 are routinely required to demonstrate Cpk values on critical characteristics before a part launch is approved, and aerospace and medical device manufacturers apply similarly strict thresholds. Regulatory guidance from bodies like the FDA for medical devices reflects the same logic: variation that isn’t measured is variation that isn’t controlled.
Beyond compliance, capability data gives you leverage in conversations that used to run on opinion. When a customer complains about dimensional drift, you can pull the Ppk from the last production run and show exactly how the process behaved over time, not just in a snapshot. When a plant manager wants to justify a new grinder or a tighter fixture, a low Cpk on the current equipment makes the case better than any anecdote. Sales teams use strong capability numbers to win business from customers who audit suppliers on statistical evidence, not promises. In short, capability indices turn "we think it’s fine" into "here’s the number, and here’s what it means for your parts." That shift, from gut feel to data, is the whole reason engineering-based process improvement outperforms guesswork on the shop floor.
How to calculate and interpret Cp, Cpk, Pp, and Ppk
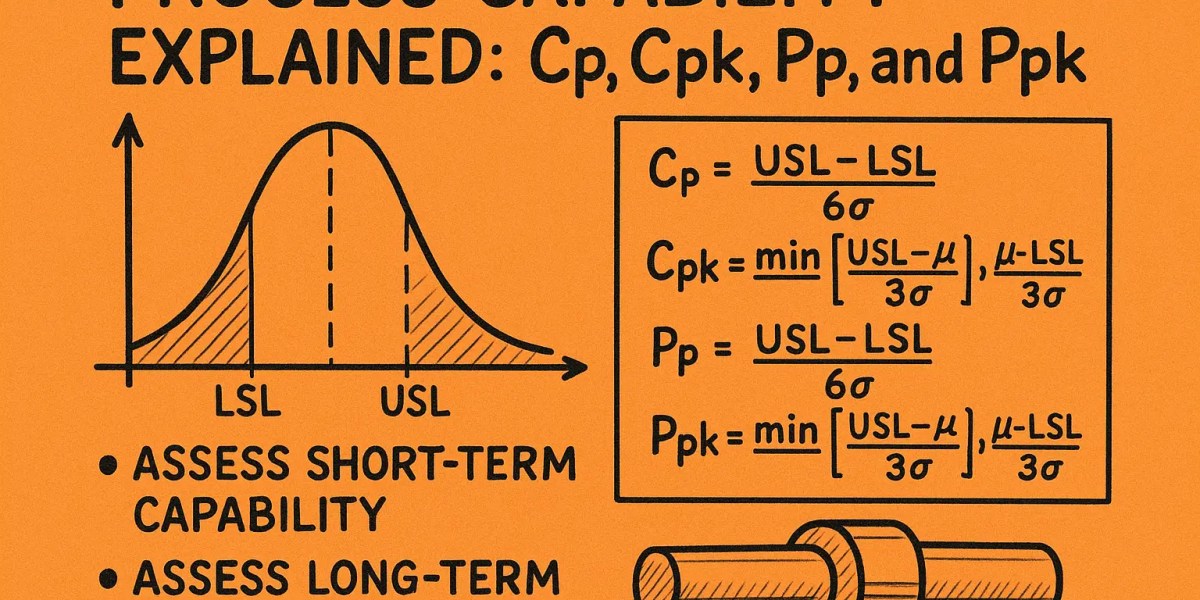
Each index answers a slightly different question, so let’s put the formulas side by side before you touch a calculator. Cp and Pp measure spread only, ignoring where the process is centered. Cpk and Ppk measure spread and centering together, which is why two processes with identical Cp values can have very different Cpk values.

| Index | Formula | What it tells you |
|---|---|---|
| Cp | (USL – LSL) / 6σ_within | Potential capability, short-term, ignores centering |
| Cpk | min[(USL – X̄)/3σ_within, (X̄ – LSL)/3σ_within] | Actual capability, short-term, accounts for centering |
| Pp | (USL – LSL) / 6σ_overall | Potential capability, long-term, ignores centering |
| Ppk | min[(USL – X̄)/3σ_overall, (X̄ – LSL)/3σ_overall] | Actual capability, long-term, accounts for centering |
The difference between the "within" and "overall" standard deviations is where most confusion starts. Cp and Cpk use short-term sigma, calculated from subgroup variation, which represents your process’s best-case performance under stable conditions. Pp and Ppk use long-term sigma, calculated from the full data set across shifts, tool changes, and material lots. That’s why Ppk is almost always lower than Cpk on the same run. If it isn’t, your process shows unusually little drift over time, which is worth celebrating, not questioning.
If Cpk looks great but Ppk doesn’t, your process has more day-to-day drift than your short-term data lets on.
Interpreting the numbers is straightforward once you know the benchmarks most industries use. A value below 1.0 means defects are essentially guaranteed given normal variation. A value of 1.33 is the common minimum for automotive and many regulated industries. A value above 1.67 signals a genuinely robust process, the kind you can run with minimal inspection.
How to run a process capability study step by step
A process capability study isn’t a single calculation, it’s a short project with real prerequisites, and skipping any of them turns your Cpk or Ppk into a number nobody should trust. Statistical validity depends on capturing the process the way it actually runs, not the way you wish it ran on a good day.

Confirm the process is stable first
Before you calculate anything, plot the characteristic on a control chart and check for special cause variation. Capability numbers calculated on an unstable process are meaningless, because you’re measuring a moving target instead of a fixed distribution.
- Plot at least 20-25 subgroups on an X-bar and R chart
- Remove or investigate any out-of-control points before proceeding
- Confirm the data follows a roughly normal distribution, or apply a transformation if it doesn’t
Never calculate Cpk on a process that hasn’t first proven it’s stable.
Collect data and run the numbers
Once the chart confirms stability, gather at least 100 individual data points, ideally spanning multiple shifts, operators, and material lots so the long-term variation shows up honestly. Enter your specification limits, calculate the mean and standard deviation, then run Cp, Cpk, Pp, and Ppk together instead of in isolation.
- Record sample size, subgroup size, and sampling frequency before you start
- Use the same measurement system you’ll rely on in production, not a lab-only gauge
- Compare Cpk against Ppk to see how much the process drifts over time
- Document every assumption so another engineer can reproduce the study
Treat the finished report as a baseline, not a formality. Every future improvement effort gets measured against this number, so get it right the first time.
Common process capability mistakes and how to avoid them
Most bad capability numbers trace back to a handful of repeat offenses, not exotic statistics errors. Assuming normality without checking is the biggest one. Cp and Cpk formulas assume a normal distribution, so running them on skewed data, like flatness or roundness measurements, produces indices that look reassuring but describe nothing real. Check the distribution shape before you trust any output.
Another frequent slip is mixing short-term and long-term data. Engineers pull a handful of consecutive parts, calculate Cpk, and present it as if it reflects months of production. That’s a Cp/Cpk snapshot dressed up as a Pp/Ppk story, and it falls apart the moment a customer audits actual shipped lots. Keep the two data sets and the two purposes separate.
A capability index built on the wrong data set will always mislead someone eventually.
Small sample sizes cause just as much damage. Calculating Ppk from 30 parts pulled from one shift tells you almost nothing about how the process behaves across a month of production, tool wear, and operator changes. Aim for the sample sizes referenced earlier, not the minimum your software will accept.
Finally, watch for specification limits that were never validated engineering requirements. Teams sometimes capability-study a tolerance band inherited from an old drawing, never confirmed against actual function. If the spec is wrong, a perfect Cpk still ships parts that fail in the field.
- Verify normality before running Cp or Cpk
- Never substitute short-term data for a long-term claim
- Use full sample sizes, not convenience samples
- Confirm specification limits reflect real functional requirements, not tradition
Catching these four issues before you report a number saves you from a much harder conversation later.
Process capability example with sample data
Numbers make more sense with a real part. Say you’re machining a shaft with a specification of 9.50mm to 10.50mm, targeting 10.00mm. You pull 25 subgroups of 5 parts each over three shifts, confirm the control chart is stable, then calculate your statistics from 125 individual measurements.
The raw inputs
Here’s what the study produces once you crunch the data:
| Metric | Value |
|---|---|
| USL | 10.50mm |
| LSL | 9.50mm |
| Process mean (X̄) | 10.15mm |
| Short-term sigma (within) | 0.12mm |
| Long-term sigma (overall) | 0.18mm |
The mean sits above target at 10.15mm, which already tells you something is off before you calculate a single index.
Running the four indices
Plugging those numbers into the formulas from earlier gives you this:
Cp  = (10.50 - 9.50) / (6 x 0.12) = 1.39
Cpk = min[(10.50-10.15)/(3x0.12), (10.15-9.50)/(3x0.12)] = min[0.97, 1.81] = 0.97
Pp  = (10.50 - 9.50) / (6 x 0.18) = 0.93
Ppk = min[(10.50-10.15)/(3x0.18), (10.15-9.50)/(3x0.18)] = min[0.65, 1.20] = 0.65
A Cp of 1.39 looks solid, but a Cpk of 0.97 shows the process is off-center enough to generate real defects.
Notice the pattern: Cp says the spread could fit the tolerance comfortably, but Cpk drops because the process drifted toward the upper limit. Then Ppk falls further still, to 0.65, because long-term variation across shifts is wider than the short-term snapshot suggested. That gap between Cpk and Ppk is your early warning sign that something, maybe tool wear or a shift-to-shift material difference, is pushing the process off target over time. Re-centering the mean back toward 10.00mm would lift every index without touching the spread at all.

Turning capability data into better processes
Calculating Cp, Cpk, Pp, and Ppk is only half the job. The real value shows up when you use those numbers to decide what to fix next, whether that’s re-centering a process, tightening a fixture, or replacing worn tooling before it drifts out of spec. Process capability explained simply means turning a formula into a decision: is this process good enough to run unsupervised, or does it need engineering attention before another lot ships?
Most plants that struggle with capability studies aren’t missing math skills, they’re missing a structured approach to acting on the data once it’s collected. That’s where outside expertise pays for itself, especially when you need a team that can run the study, train your operators to sustain it, and help you hire the talent to keep improving after the consultants leave.
If your Cpk numbers keep coming back lower than you’d like, don’t just recalculate them. Contact our team and let’s build a plan to fix the process behind them.